Budapest rental price prediction
A reproducible offline modelling artifact for ingatlan.com's data team — temporal validation, geospatial enrichment, and model diagnostics.
MSc Business Analytics · Central European University · June 2026 · source repo ↗
[§U]Use case
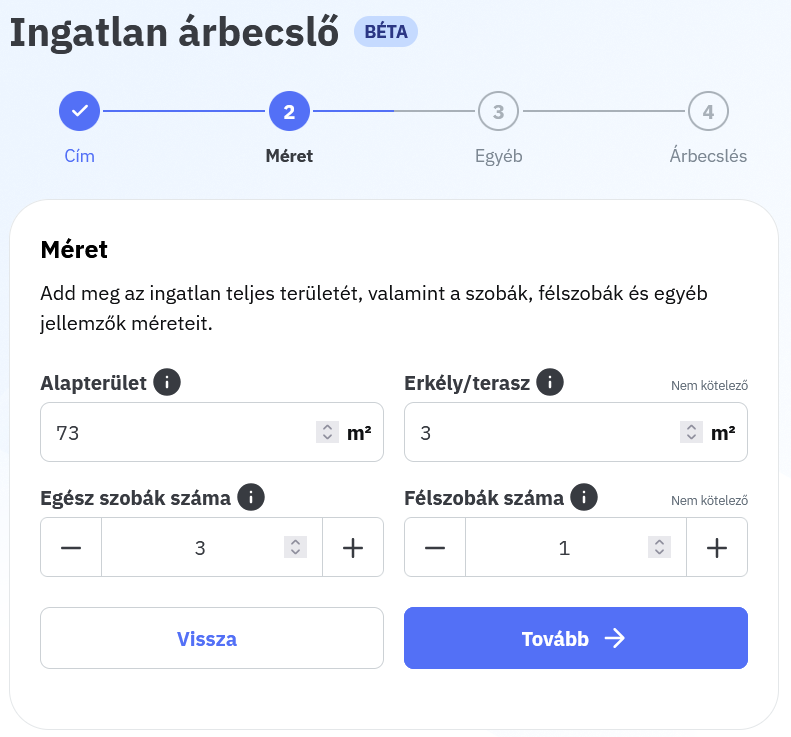
Suggest a rent in seconds, list faster
A landlord opens the upload flow and enters the characteristics of the flat they want to let — area, rooms, floor, condition, balcony, and so on. Before they finish, the page shows a suggested monthly rent. Because the number is credible and arrives instantly, they price competitively from day one, list sooner, and start earning rent earlier.
The chain is simple: faster pricing → quicker listing → happier landlord → higher engagement → more supply on the platform. For ingatlan.com, which leads the Hungarian for-sale market but faces stiffer competition in rentals, this is a direct lever to grow the rental user base.
[§1]The decision this supports
Can we suggest a credible rent at upload?
The capstone stays offline — modelling and recommendations, not deployment or A/B testing. The question is whether a model can hit the accuracy target given the data, scope, and product constraints.
- Scope: Budapest rental flats.
- Target: monthly rent per square metre (HUF/sqm).
- Metric: MdAPE — typical absolute % miss.
- Success criterion: ≤10% MdAPE, set by the client. Met at ~9.8% in time-ordered CV.
[§2]Data & temporal validation
Why the newest 20% is reserved
Budapest rental prices move quickly, so a random split would leak market-regime information from the future. Candidate selection uses rolling time-series CV on older listings; a frozen holdout on the newest 20% is kept for the eventual production go/no-go.
[§3]Pipeline · medallion architecture
Bronze → silver → gold
The medallion pattern layers a warehouse into three progressively curated tiers. Bronze is raw ingested data as it arrived, with lineage but no cleaning. Silver is typed, deduplicated, and quality-checked — the same shape as source but trustworthy. Gold is modelling-ready feature marts: business rules applied, scope filters baked in, joins with enrichment tables done.
This capstone follows the same shape: raw listing dumps land in a bronze layer, the data-prep pipeline produces a cleaned silver extract, and the modelling table plus geospatial features form the gold layer that CV and the holdout consume.
  bronze                silver                 gold
  ──────                ──────                 ────
  raw dumps    ─────►   typed / cleaned  ────► modelling extract
  ingatlan.com          scope filters          + WorldPop lag features
  scrape                dedup + QA             + NDVI H3 features
                                               + 90-day comparable prior
                                                     │
                                                     ▼
time-series CV + holdout[§4]Model leaderboard
Boosting clears the 10% bar; linear stays close
Same target, same rolling time-series CV, same metric. Boosting leads at ~9.8–9.9% MdAPE, but well-specified linear models are only ~0.2 pp behind — and both are ~7 pp better than a district-median baseline. Stability and product fit matter more than the marginal CV gain.
| model | CV MdAPE | CV MAPE | MAE HUF/sqm |
|---|---|---|---|
| XGBoost (log price/sqm) | 9.84% | 12.19% | 629 |
| HistGradientBoosting | 9.86% | 12.24% | 632 |
| LightGBM | 9.94% | 12.33% | 635 |
| Ridge | 10.06% | 12.61% | 646 |
| OLS | 10.07% | 12.58% | 645 |
| Random Forest | 10.78% | 13.29% | 693 |
| district median (baseline) | 16.80% | 19.32% | 1,010 |
| dummy median (baseline) | 17.95% | 20.26% | 1,067 |
[§5]What the model attends to
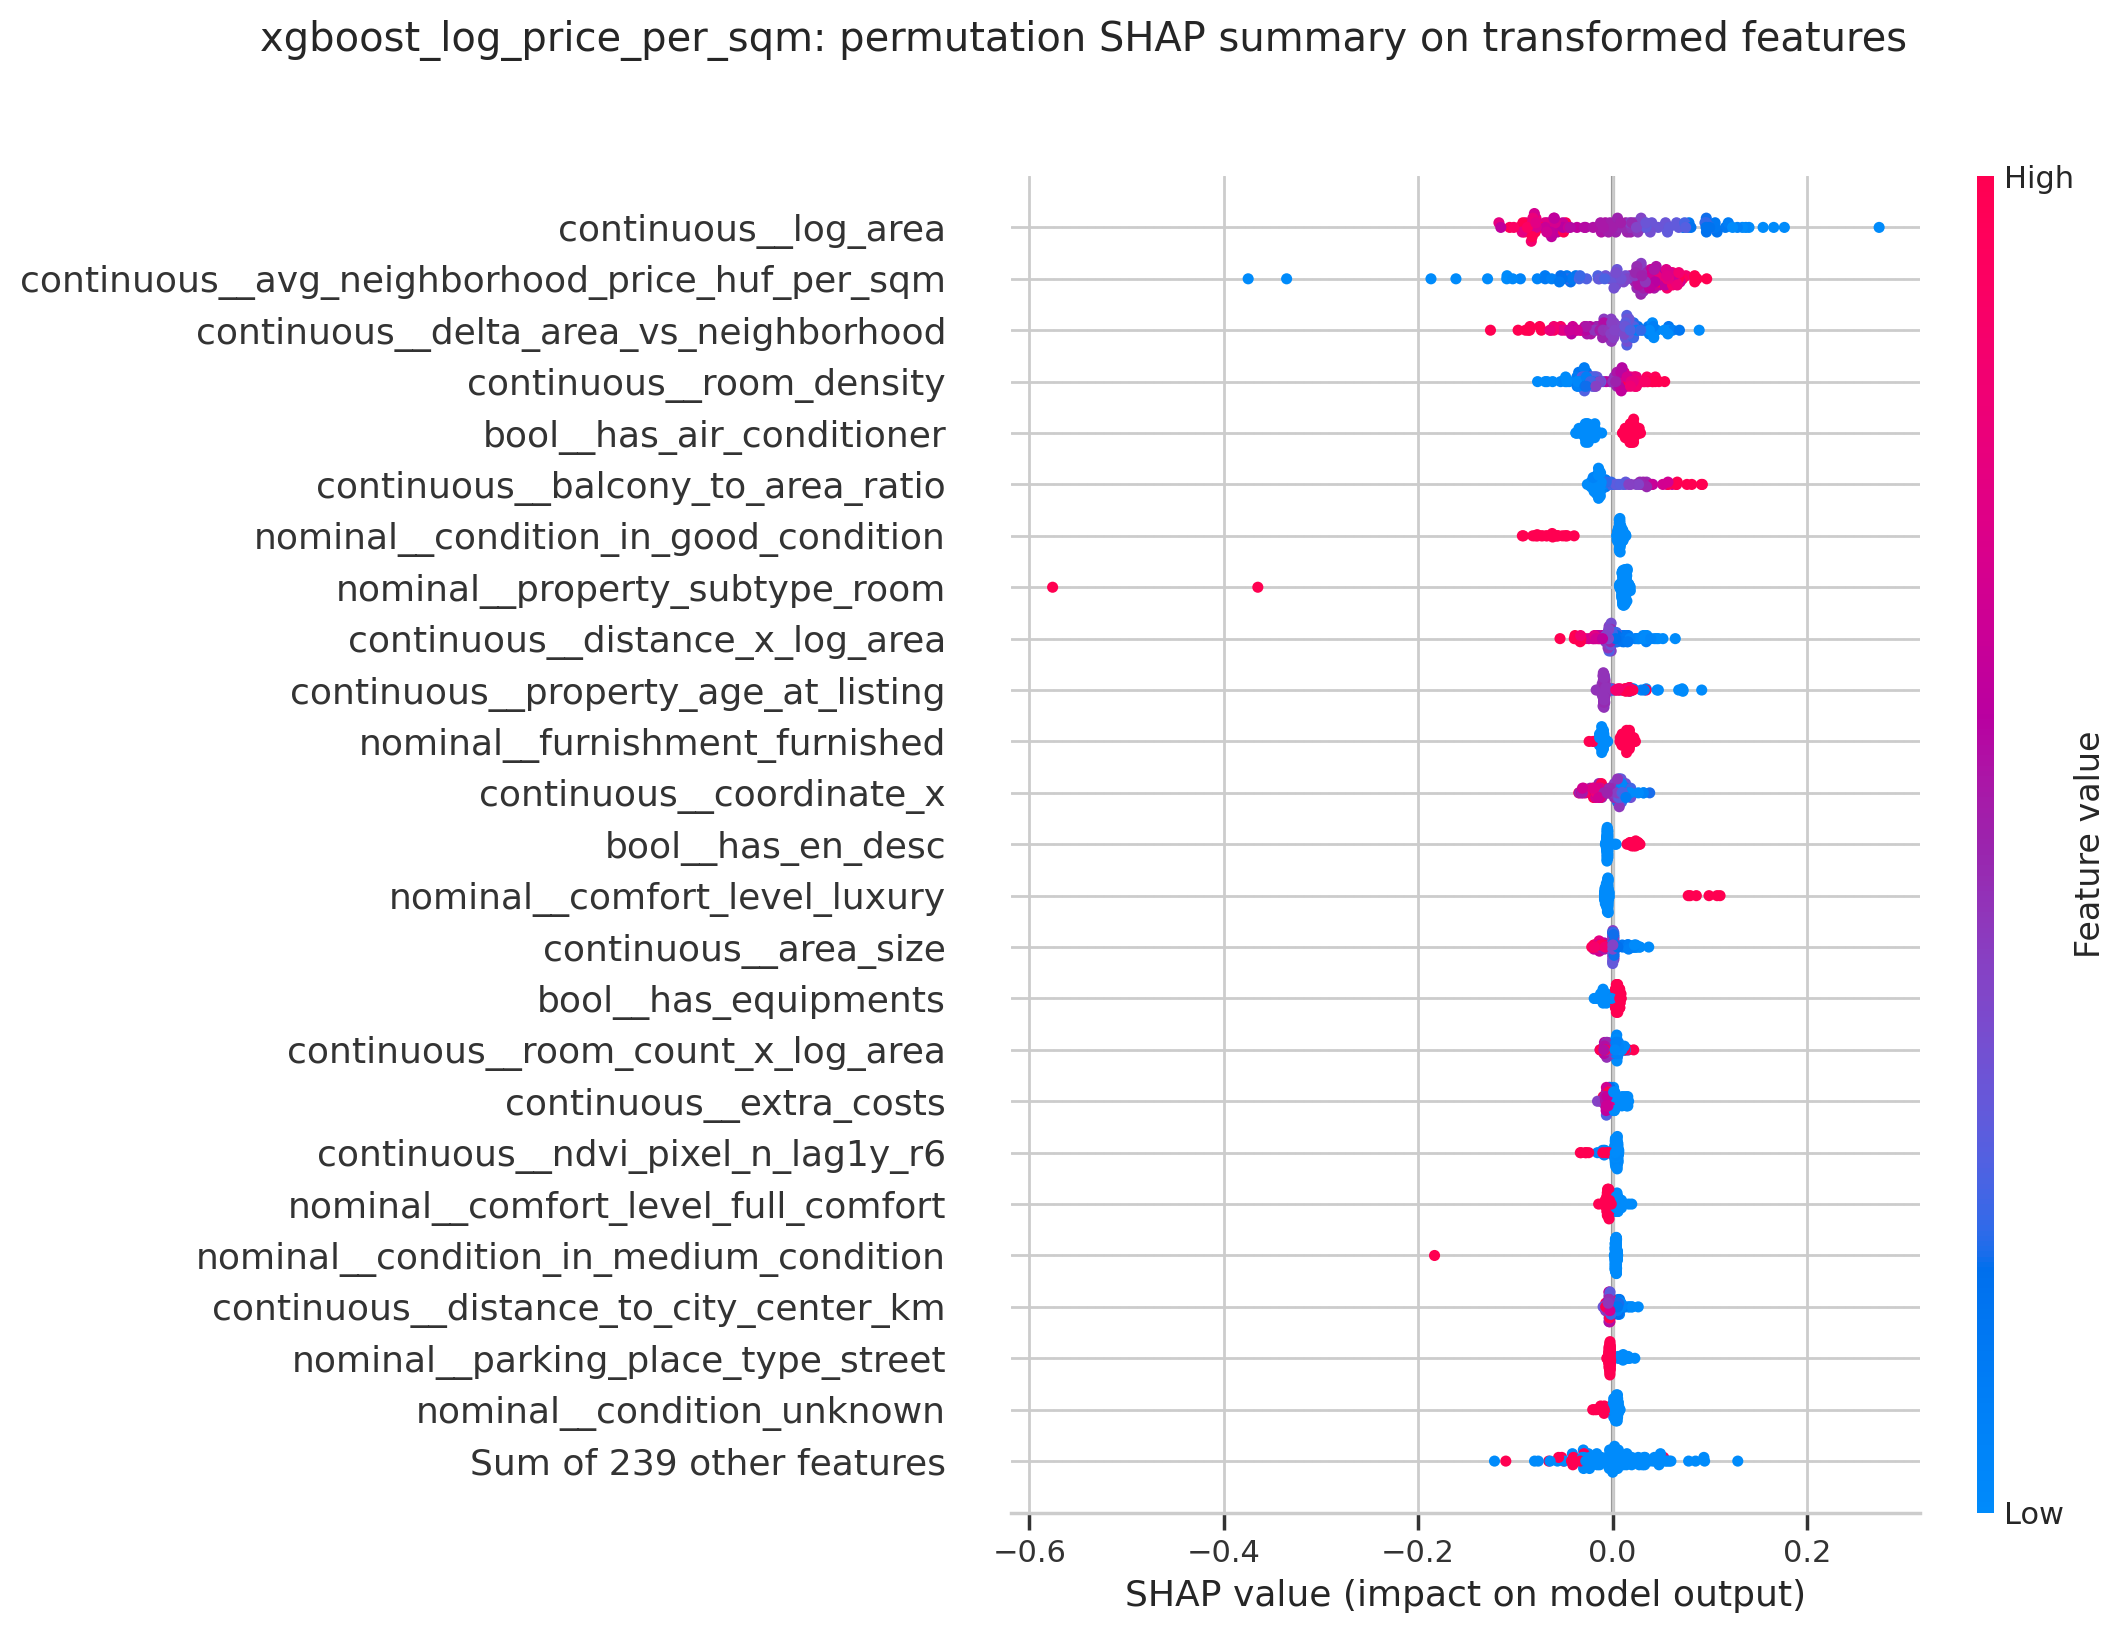
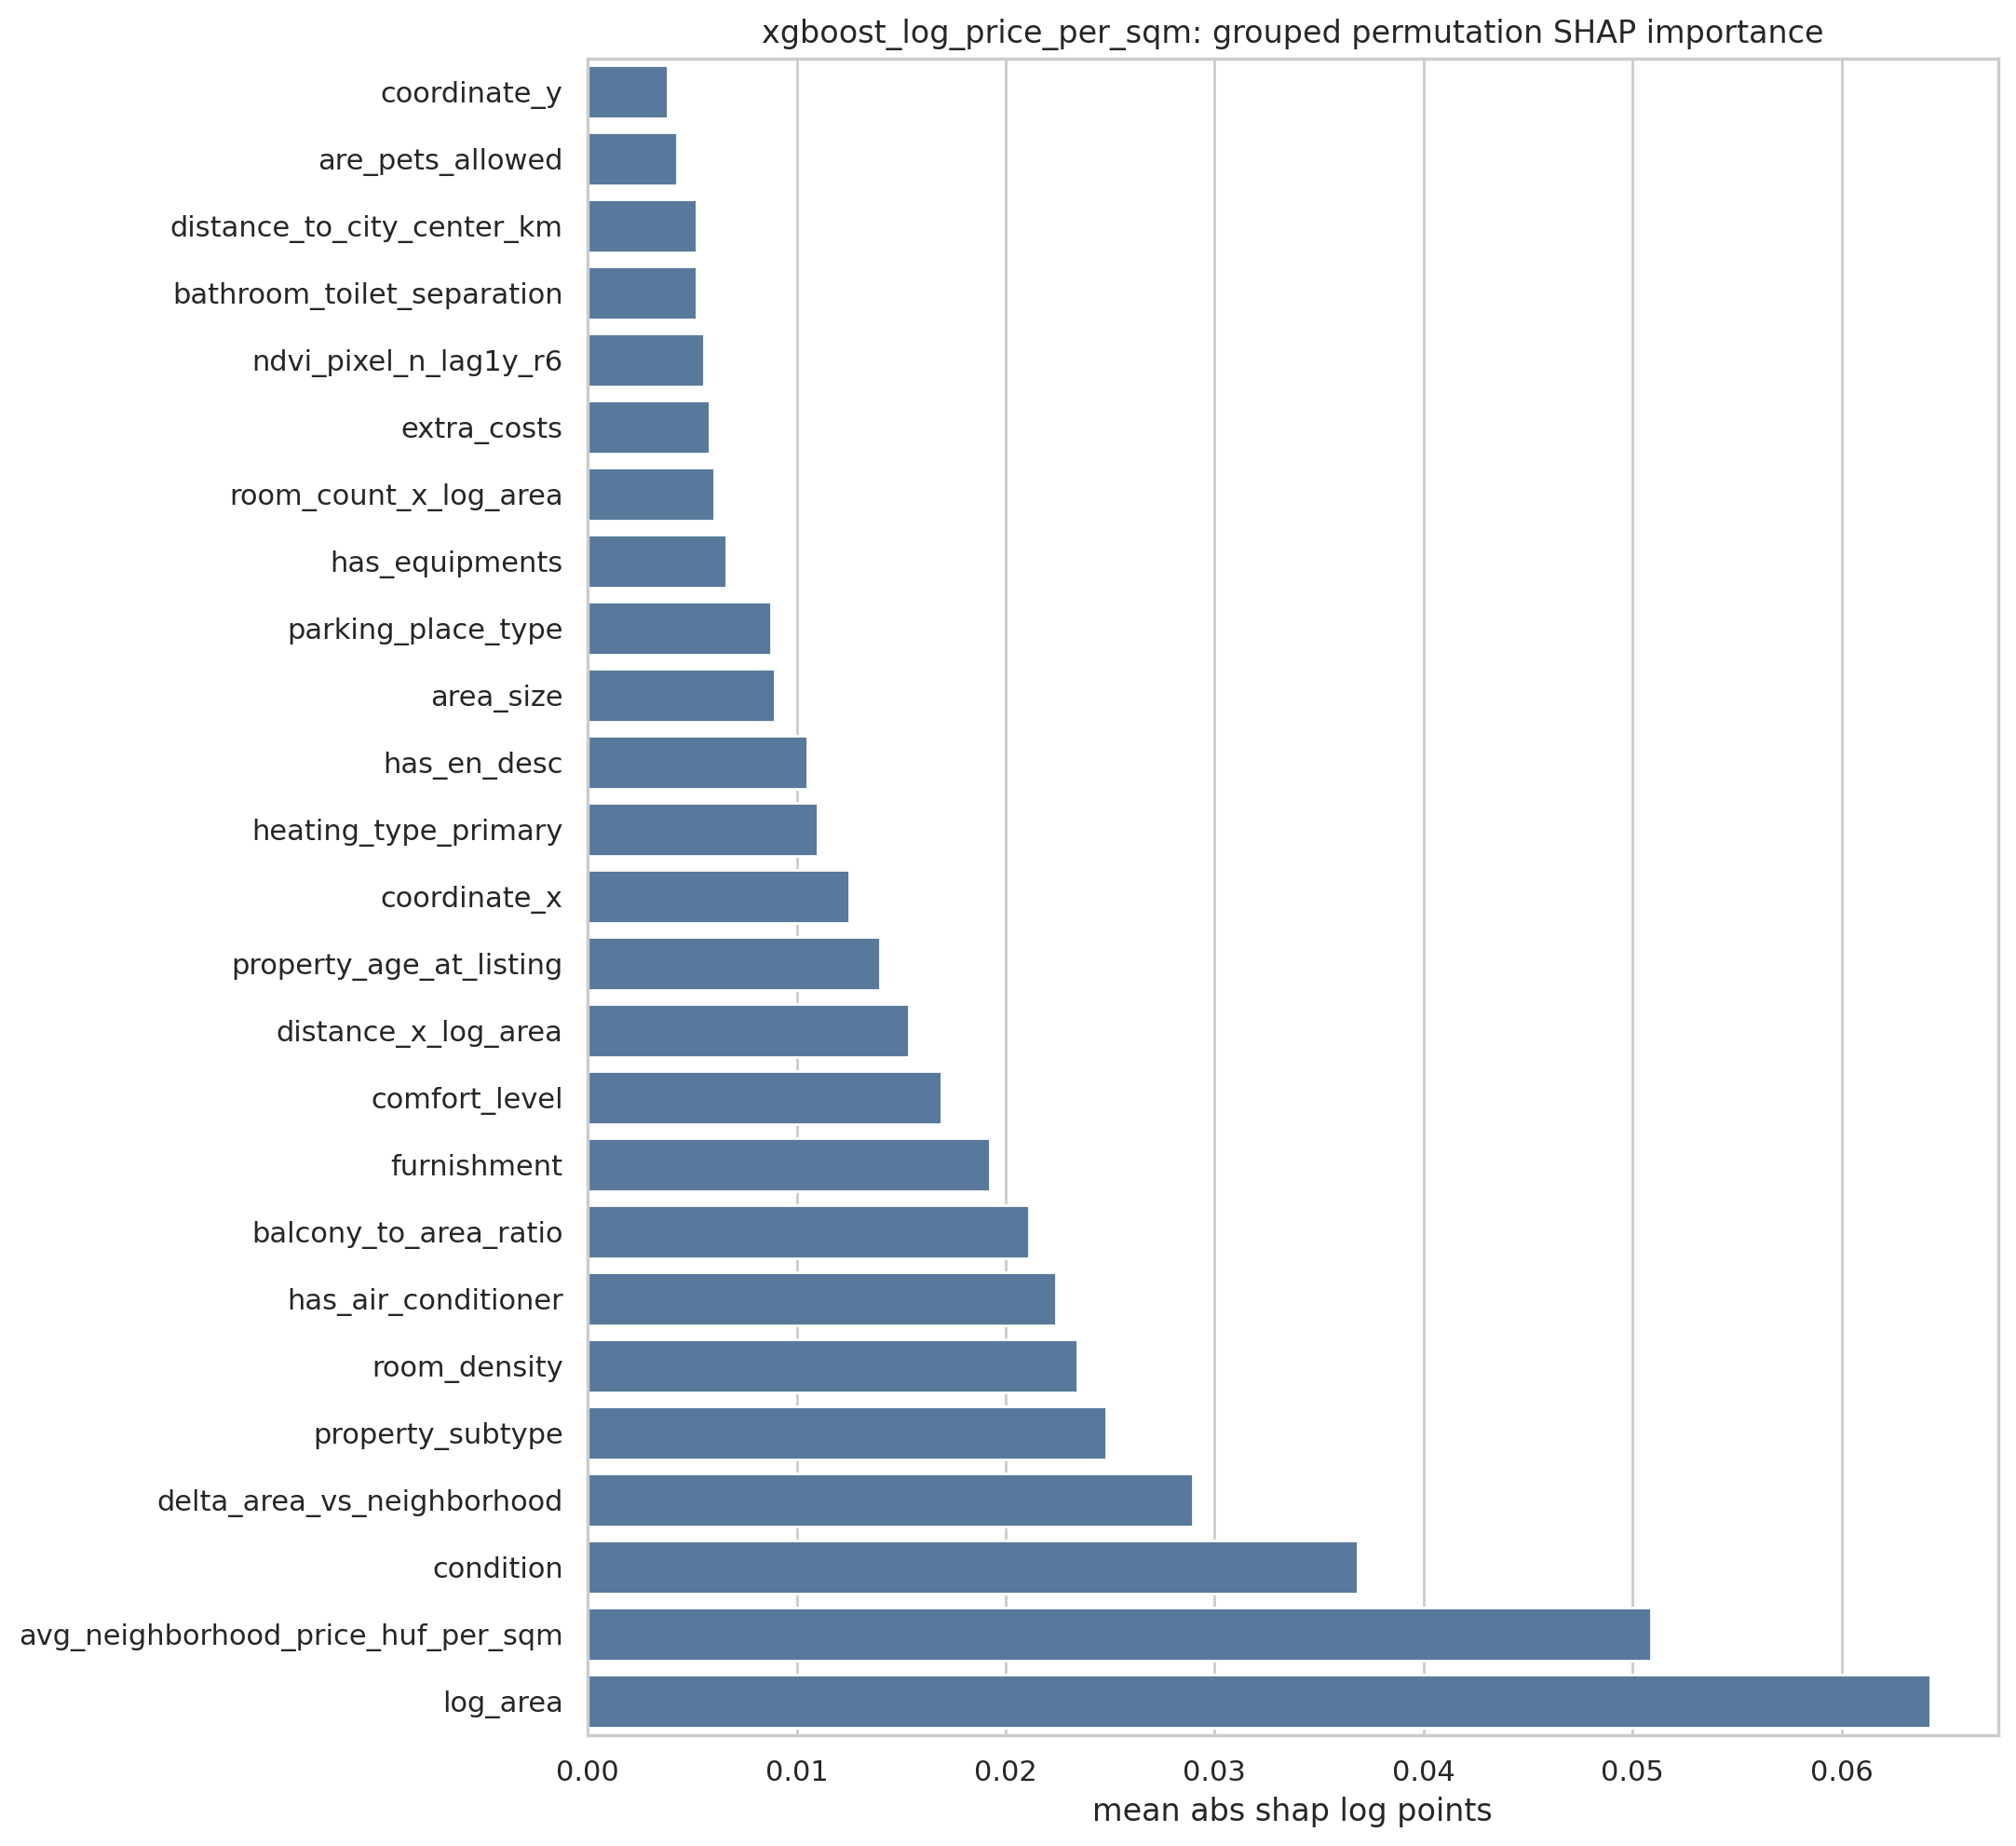
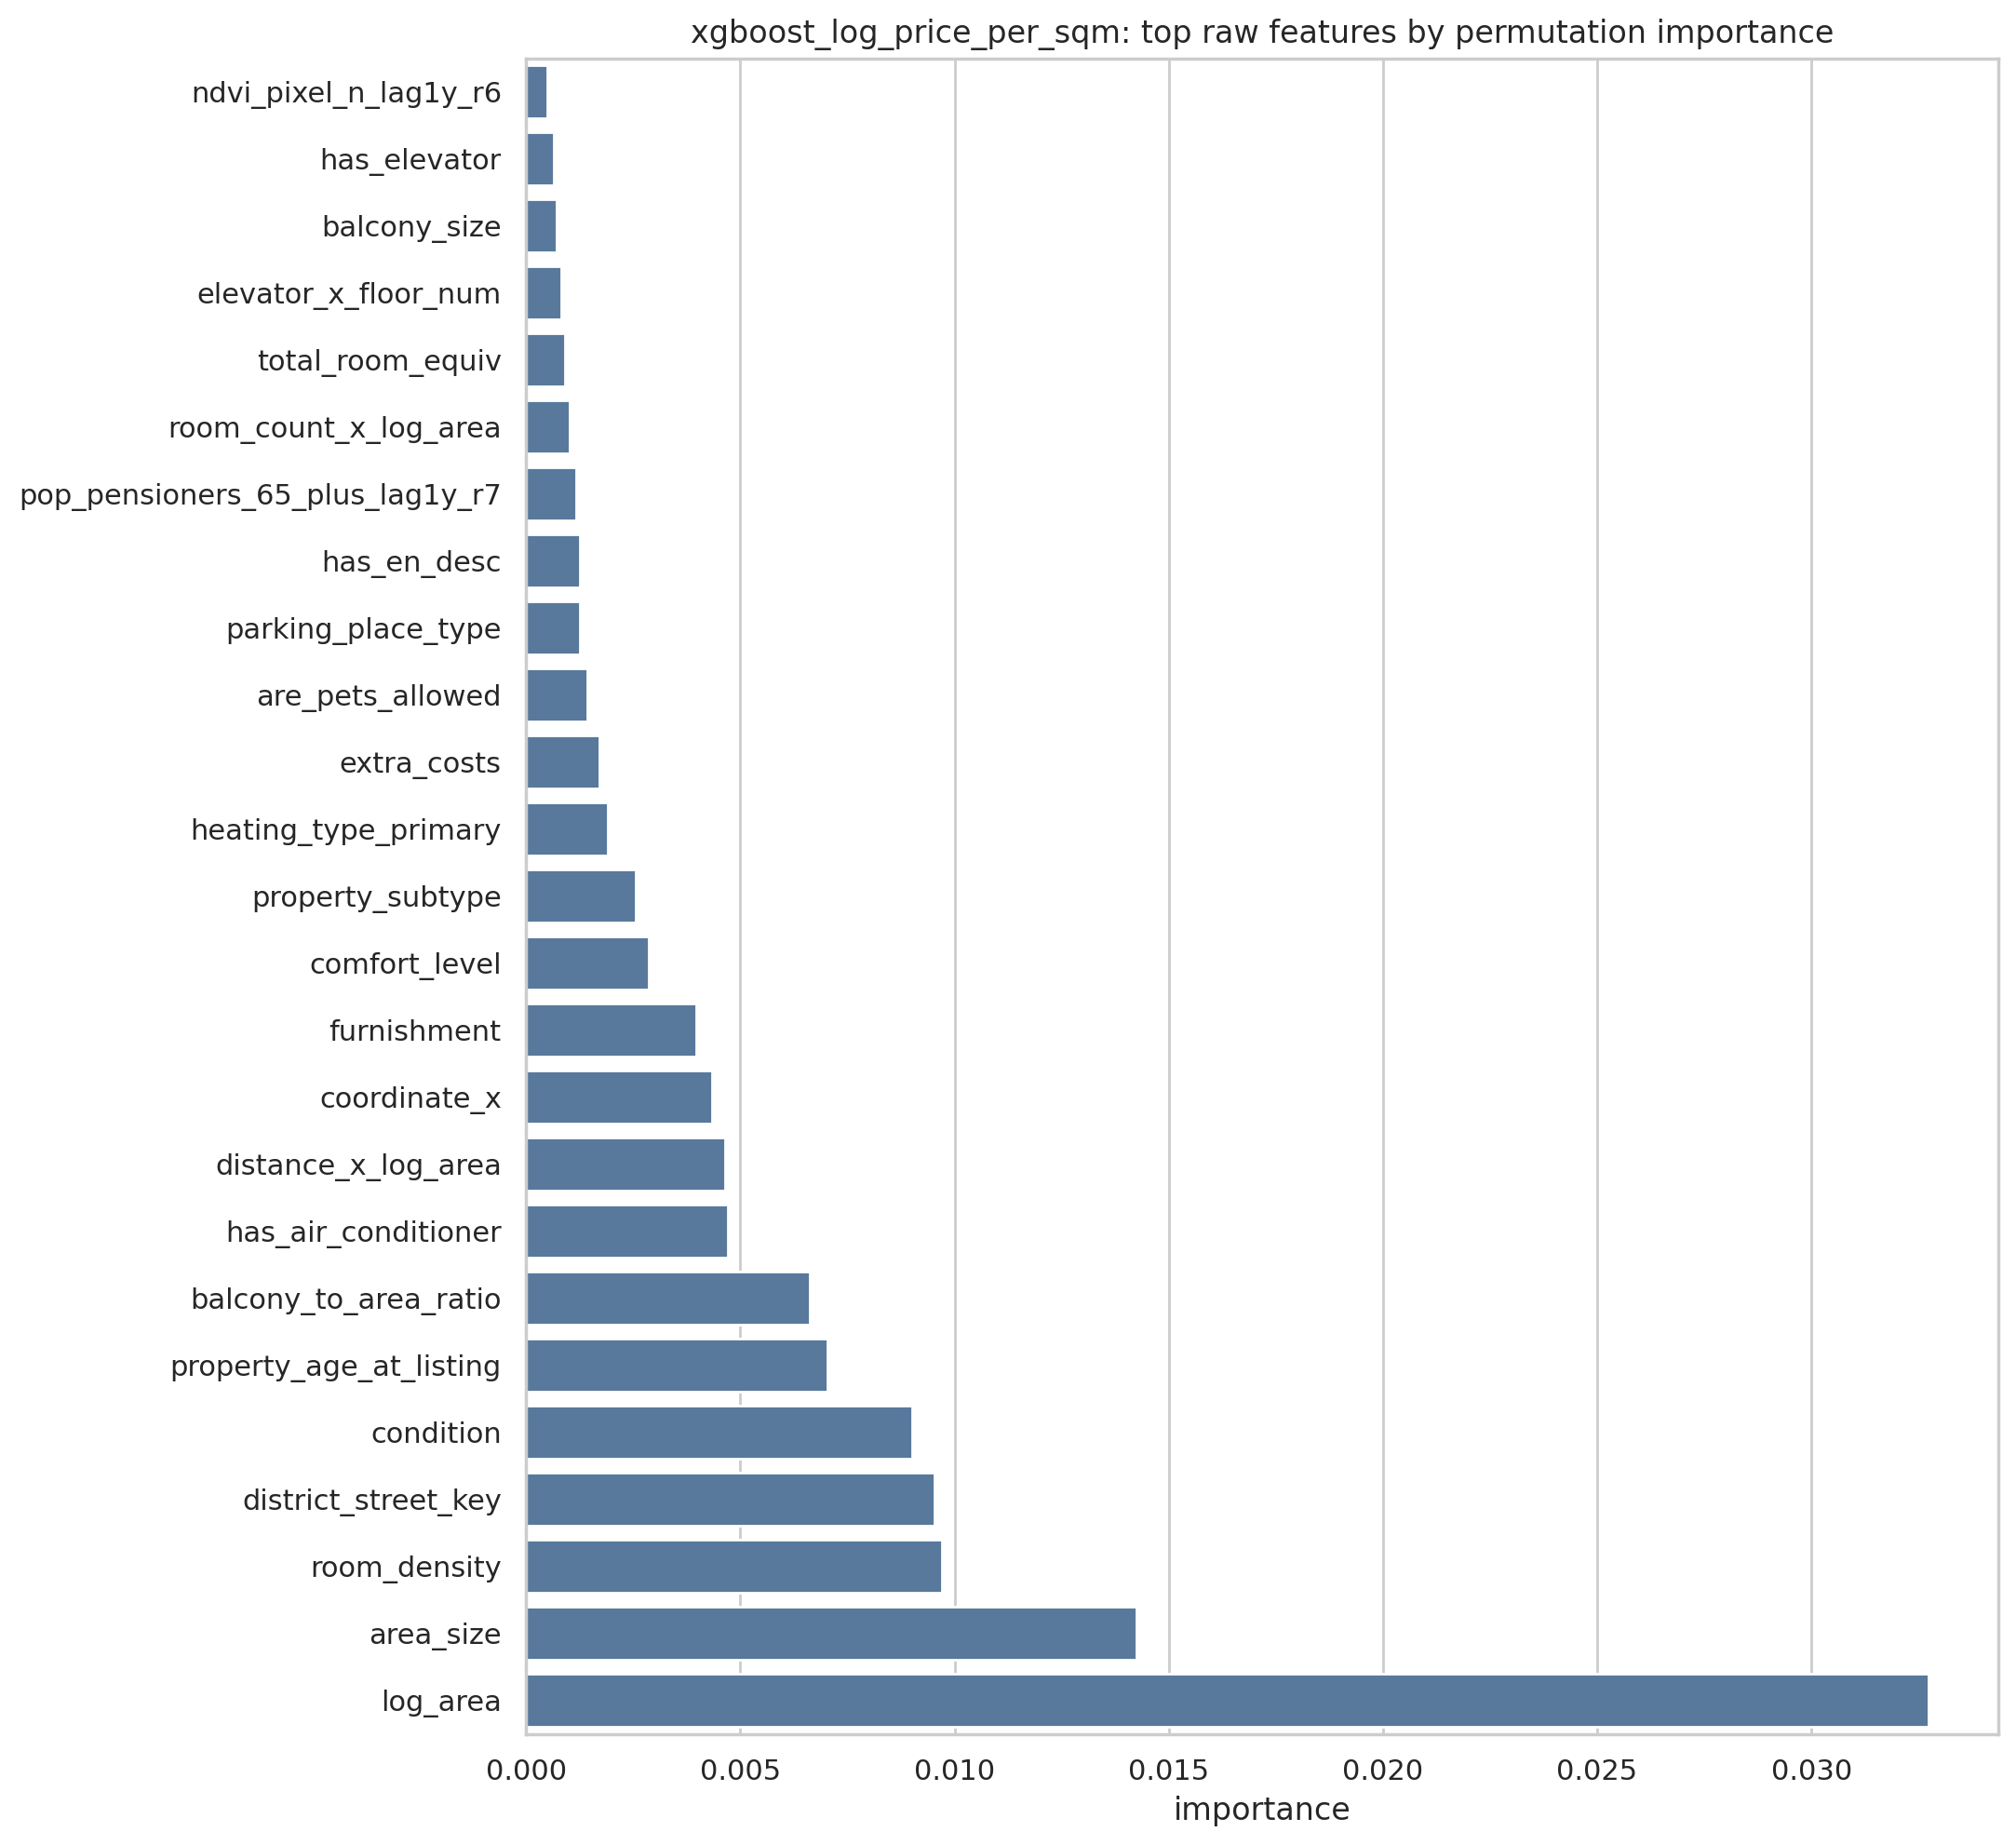
Size, comparables, condition, location
Filling core structured fields matters more than adding NLP at this stage. The neighbourhood comparable prior and location features carry strong signal, confirming the client team's interim feedback. Importance is not causality — use it for field prioritization and sanity checks.
[size & layout] [local comparables] [condition] [balcony ratio] [air conditioning] [centrality]
Interaction terms kept in the model
A small set of numeric interactions, chosen to represent plausible housing-market effects without exploding the one-hot feature space.
| term | formula | interpretation |
|---|---|---|
| Distance × log area | centrality × log(area) | Centrality gradient differs by flat size. |
| Balcony × distance | balcony × distance to centre | Balcony premium may vary with centrality. |
| Elevator × floor | elevator × floor number | Higher floors are valued differently when an elevator exists. |
| Room equivalent × log area | eff. rooms × log(area) | Layout usefulness interacts with size. |
| Balcony-to-area ratio | balcony size / area (capped) | Bounded ratio, not simple multiplication. |
| Room density | eff. rooms / area | Captures compactness of the layout. |
[§6]Geospatial enrichment
Population and greenness, lagged and historized
WorldPop
- Hungary rasters, 2020–2025.
- H3 resolutions 6, 7, 8.
- Total population + age/sex cohorts.
- Lag: a 2025 listing sees 2024 features.
NDVI greenness
- Sentinel-2 L2A via Microsoft Planetary Computer.
- Summer composites, 2020–2025.
- H3 mean, p90, and pixel count.
- Point coverage ≈ 100% for the prototype.
Geospatial features stay lagged and source-dated to avoid leakage. Static land cover is useful for EDA but is not aligned with historized validation.
A quick primer on H3
H3 is Uber's open-source discrete global grid: the earth is tiled with hexagons, each with a stable string ID (e.g. 8830953b13fffff). Hexagons are convenient because every neighbour is the same distance away, so aggregations and lookups behave uniformly. Resolution controls cell size — res 6 covers a metro area, res 7 fits a district, and res 8 (used below) is about the size of a few city blocks, matching how buyers think about local rent.
Fig. summer Sentinel-2 NDVI, aggregated to H3 res-8 cells over Budapest. Darker green = more vegetation, useful as a proxy for green-space amenity around a listing.
[§7]Implications for the upload flow
Fields worth prioritizing
- Area, rooms, and room density.
- Condition, comfort, subtype, heating.
- Balcony size relative to area.
- Air conditioning and equipment flags.
- District, zone, and enough address detail for local signal.
Potential UX pattern
- Predict HUF/sqm; multiply by area for total rent.
- Show a range when uncertainty is high.
- Suppress the suggestion when coverage or slice reliability is poor.
- Optionally show "what drives this estimate" via a local SHAP explanation.
[§8]Risks & recommended next steps
| risk | why it matters | mitigation in the artifact |
|---|---|---|
| Temporal leakage / drift | Prices move quickly. | Chronological split, rolling CV, reserved newest 20%. |
| Aggregate metric hides local failure | Districts / subtypes behave differently. | District + subtype MdAPE slices before product claims. |
| Missing optional fields | Model can lean on data users don't always provide. | Pipeline imputation, coverage guardrail, missingness profile. |
| Scope creep to national rentals | Budapest priors misprice countryside listings. | Explicit Budapest-only pilot; retrain + validate for rollout. |
| Business-metric gap | MdAPE gains may not reduce time-on-market. | Acceptance bands + later link predictions to TOM / experiment. |
One-shot holdout run; publish MdAPE / MAPE / RMSE, total-rent errors, coverage, and slice diagnostics.
Map the 10% MdAPE target to product behaviour: exact suggestion, range, or none.
Budapest rental flats only; monitor input coverage and prediction drift.
Bottom line: a credible, reproducible offline artifact and a practical roadmap. The remaining decision is product governance, not more exploratory modelling.
[§A]Appendix
Diagnostics, feature policy, data quality
Feature policy
- Core structure: area, rooms, floor, age.
- Quality / amenity: condition, comfort, subtype, furnishment, heating, balcony, aircon.
- Location: district / zone aggregates, distance to centre.
- Fold-safe 90-day neighbourhood prior + local deltas.
- Lagged WorldPop and NDVI features.
- Rent per sqm is the target, never a feature.
- Total rent is not a feature.
- No fine-grained street or geo-cell identifiers.
- Listing text bodies not used; only language-presence flags.
- Model-specific filters stay downstream of the modelling table.
Data-quality summary
| check | result | action |
|---|---|---|
| Duplicate records | None observed | Passes basic uniqueness. |
| Non-positive target / area | None after filters | OK after downstream scope rules. |
| Weak location quality | ~1% of rows | Coverage guardrail; avoid forcing location features. |
| Building floor count missing | ~22% | Resolved earlier contradiction; imputed inside CV folds. |
| Common charges missing | ~72% | Useful when present; not a mandatory UI dependency. |
| Utility costs missing | ~48% | Impute and monitor; potentially improve upload completion. |
Source repo: github.com/balintdecsi/ceu-public-thesis · Original slide deck: html deck ↗